PulsarSignals
✨ Discover Next-Gen Stock Signals

Stock Technical Analysis & Peer Comparison

RSI, MACD, moving averages and support/resistance levels for U.S. stocks — end-of-day readings you can audit.

Jump to: AAPL · MSFT · NVDA · TSLA · AMZN · AAPL vs MSFT · Methodology

PulsarSignals.com leverages advanced algorithms to provide end-of-day stock signals, technical analysis, and market insights to help you make informed investment decisions. Unlock Your Profit Potential with Advanced Signals

End-of-Day Data Updates Smart Algorithm Analysis Clear Investment Insights
Scroll down for Stock Tools

Stock Compare Tool

Compare with prediction and analysis more thoroughly

VS

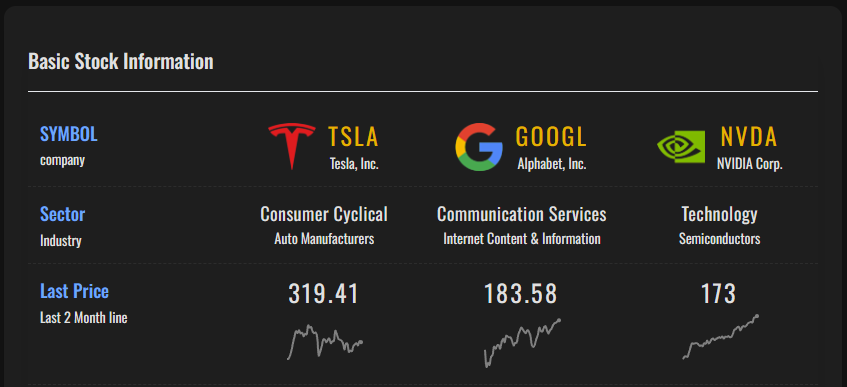
view stock compare example:TSLA_vs_GOOGL_vs_NVDA

Our Analysis Features

Empowering Informed Decisions with Advanced Data Analytics

Technical Indicators

Comprehensive analysis using over 50 technical indicators including MACD, RSI, Bollinger Bands, and more.

Technical Signals

Buy and sell readings derived from RSI, MACD, moving averages and volume, recomputed after each market close.

Historical Performance

Review past signal performance and backtesting results to validate trading strategies.

Market Sentiment

Analyze market sentiment and social media trends to gauge investor psychology and market direction.

Custom Alerts

Set up personalized alerts for price movements, indicator crossovers, and pattern formations.

Multi-timeframe Analysis

Analyze markets across multiple timeframes from 1-minute to monthly charts for comprehensive insights.